

Solution for the Harmonic Vibration Test with Base Excitation
Harmonic Response is one of the most popular simulation applications allows the engineers to consider the dynamic characteristics of the structure under the effect of the vibration excitation. It is often used to represent the experiments of the vibration testing in the design phase and pre-production.
Harmonic Response analysis helps to check if the structure works in resonance mode? And provide information for evaluating how much load the structure can withstand until it will be damaged (due to fatigue or crack appearance)? And help to determine how amplitude, frequency of the load affecting on the durability of the structure? All the answers of these questions can be explored based on the analytical results of Harmonic Response simulation.
Actually, the response of the structure under the harmonic load over time consists of 2 stages:
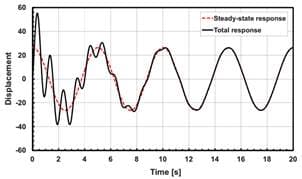
Figure 1: Time-History Response of the structure under the harmonic load.
- Stage 01: transient stage is characteristic of this stage. The vibration is the combination of the natural vibration and forced harmonic response of the structure. The natural vibration will decay to zero over time.
- Stage 02: steady-state vibration under the harmonic excitation. The structure is vibrated harmonically with the frequency of the forced excitation.
Harmonic Response considers only the stage 02 of the response of the structure. It means the structure vibrates steady under the harmonic excitation.
In the previous article, a modal analysis determined the natural dynamic characteristics of the structure. In this article, a harmonic response analysis will represent the vibration testing under a harmonic excitation, in order to investigate the resonance responses of the structure.
An acceleration excitation generated from the vibration test equipment is applied on the fixed support of the structure. For example, the amplitude of the harmonic load is 5G (G is earth gravity acceleration = 9.81m/s2), and the investigation frequency range from 5Hz to 1000Hz. The desired result is the acceleration response at the considered location, including amplitude, The phase shift angle of the response phase and the input load phase.
In the Figure 2, the response results (the amplitude and phase angle of the acceleration at a specific location on the heat sink component) are shown. From the graph, we can see a jump in value at some positions. These jumps are due to a resonance — the frequency of the excitation force is close or equal to the natural frequency of the structure.
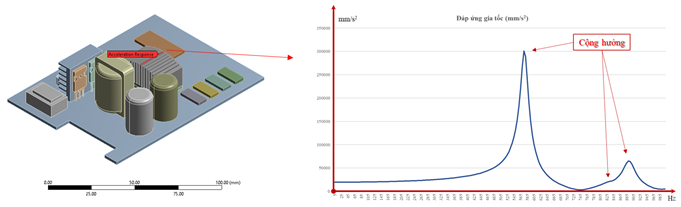
Figure 2: Some of the simulation results related to product vibration testing using ANSYS Software
With Harmonic Response analysis, we will predict the vibration response at every point of the structure, ensuring not to miss any dangerous locations that cause damage to the structure.
Figure 3: Total Deformation contour result at 1000Hz (Frequency of the excitation force)
The results can be assessed in a harmonic response analysis:
- Maximum response amplitude in the investigated frequency range (Maximum over Frequency)
- Frequency causes the maximum response amplitude (Frequency of Maximum).
- The phase angle causes the maximum response amplitude at a specified frequency (Maximum Over Phase)
- Relationship between the response amplitude and phase angle at a specified frequency (Phase of Maximum)
These results will help answer the questions:
- What frequency does the largest response occur on the structure?
- Where does the biggest response occur on the structure?
- What is the maximum amplitude of response on the structure?
To get more information on this analysis or related simulation solutions, please feel free to contact us: info@advantech.vn
Please specify "Source Advantech, Jsc." or "According to www.advantech.vn" if you want to disseminate this information